Reporting Overview
Impressions and clicks are just the beginning – rich media requires a deeper look to understand how audiences are engaging with your ads. Track Twitter shares, video view length, time on unit, downloads, forms submitted, and more!
- This article provides an overview of Real-Time Analytics. Select Analytics in the Dashboard, and click on the campaign you'd like to see reporting for.
Overview Report
(This is the first report to show by default)
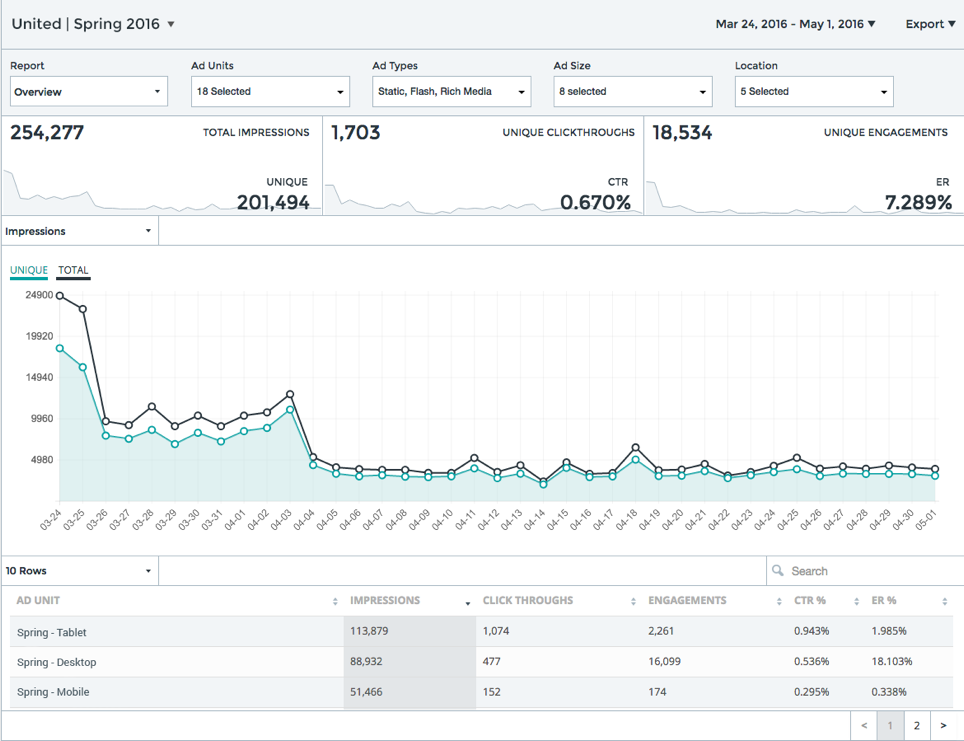
Campaign (in this example, “United Spring 2016”): The campaign dropdown allows you to easily navigate from one campaign to another. All campaigns associated with the active advertiser are displayed.
Date Range (in this example, “Mar 24, 2016 – May 1, 2016”): The date dropdown menu in the top right corner allows you to change the date range for which data is displayed. You can choose 7, 30, or 60 day views, This Month or Last Month. You can also view the entire campaign or a Custom Range (select, then put in From and To dates and Apply).
Export (click on drown arrow on far top right): All campaign data is easily exported to Excel format via email – the default email address will show as you – you can change the email address to anyone you want to receive the report.
* The final report will show each type of report in a separate tab and only the reports with metrics (for example - if you do not have a video in your ad, a Video report will not show).
For Automated reporting - please see article here.
Filters
Adventive gives you flexible ways to view and filter your campaign data. You can filter by report type, ad unit, ad type, ad size and location to customize the data that's displayed in your report. For example, if you only want to see data from one specific State or DMA, you can select that location from the location filter. Filters are persistent as you drill down or choose other reports.
To set filters click the dropdown menu for the type of object you want to filter by. Use the checkboxes to select the items that you want to include in your report. Click All to select all items, or click None to deselect all items.
Available Filters
Report: Use the report dropdown to navigate between the eight main reports - Overview, Engagements, Conversions, Location, Video, Site, Slideshow, and Feed Parser Carousel.
Ad Units: Select the ad units to include in the report from a list of all ad groups and associated ad units.
Ad Types: Filter by type of ad - Static, Flash or Rich Media.
Ad Size: Filter by ad dimensions (size and width).
Location: Filter by location.
KPIs
Campaign KPIs are displayed at the top of every report and provide a snapshot of key metrics over time.
Metric Selector
The report drill down allows you to select the type of data you want to show. The metrics and dimensions that are available depend on the report you're viewing. The available categories are listed in the dropdown above the main graph section. When you change the metric category for the graph, you also change the metric category for the data views below.
Graphs + Charts
The main graph provides a visual representation of performance based on report type.
Data Table
Below the main graph is a data table, which shows detailed performance information based on report type and dropdown.
Show Rows
Select the number of rows to view in the table.
Search
Search to filter on a specific keyword string.
Sort columns
Click on the arrows to the right of each column to sort them. Click again to reverse the sort order.
Metrics Overview
| Total Impressions | Number of times an ad was rendered on the page. |
| Unique Impressions | Number of unique users to whom impressions were delivered. |
| Clicks | Number of clicks on a target URL (includes backup image clicks). |
| Unique Clickthroughs | Number of unique users that clicked on a target URL. |
| CTR (Clickthrough Rate) | Ratio of clicks to impressions - ratio of users who click on a specific link to the # of total users who view the ad. |
| Engagement | User-initiated event - in banner action that does not result in a clickthrough. Includes hovers, video plays, expansions, Tweets, etc. |
| Total Engagements | Total number of user-initiated events. |
| Unique Engagements | Number of impressions with a user-initiated event. |
| ER (Engagement Rate) | Ratio of unique engagements to total impressions. |
Reports - There are nine main report types:
Overview Report
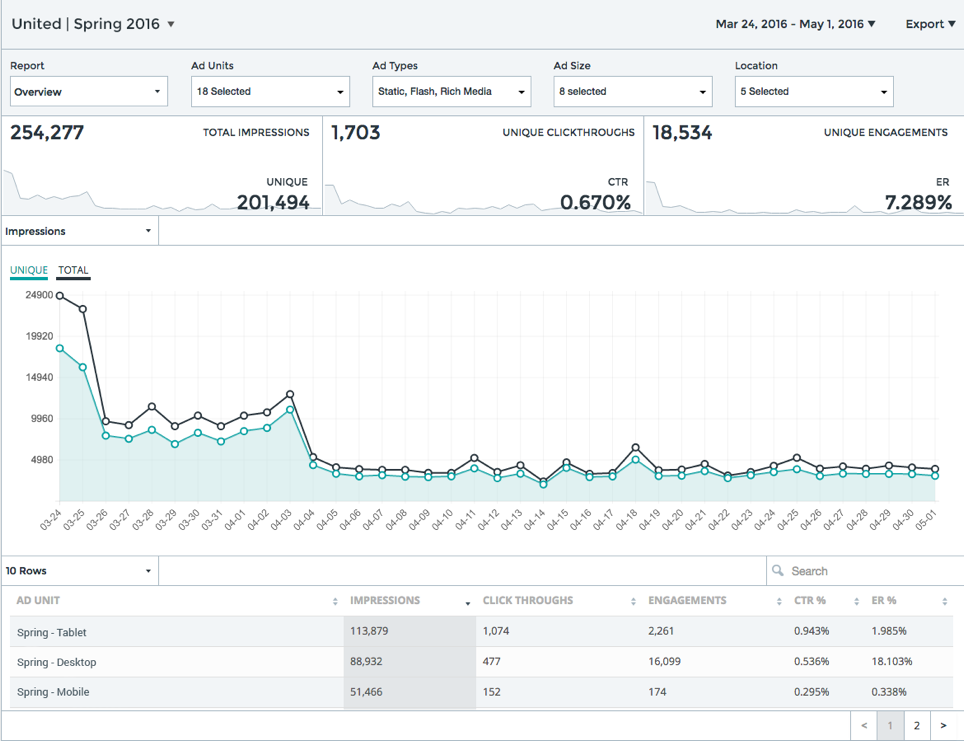
The Overview Report provides a consolidated view of campaign performance, including impression, clickthrough data and engagements. You can view all ads within the campaign or use filters to view individual ad or ad group performance.
- Impressions – total number of times an ad was rendered on the page. At Adventive, we log an impression once the ad is called from the 1st party ad server.
- Click Throughs – number of users that clicked on a target URL.
- Engagements – user-initiated events, in banner actions that do not result in a clickthrough (includes hovers, video plays, expansions, tweets, etc.).
- CTR% - percentage of clicks to impressions (ratio of users who click on a specific link to the # of total users who view the ad).
- ER% - percentage of unique engagements to total impressions.
- Viewable Impressions – number of impressions served and viewed (ad was on 50% of the site for 1+seconds). *Ad units with videos need to be in view for 2+ seconds before counted as viewed.
- Viewable Rate – Viewable Impressions divided by Total Impressions.
Engagements Report
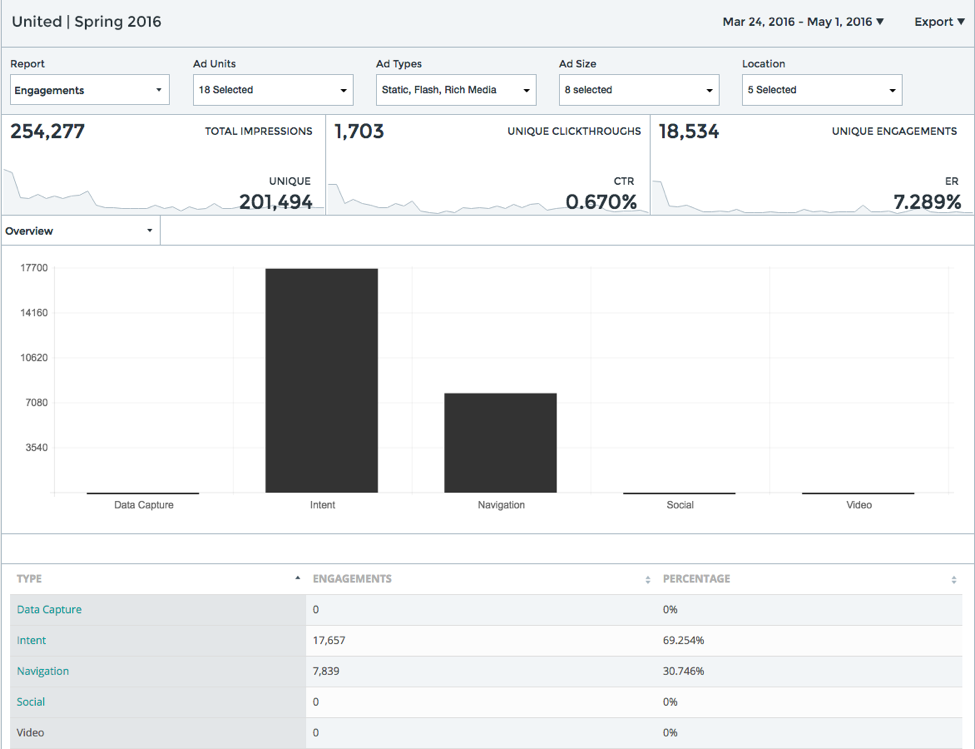
The engagements report provides a comprehensive look at how users are engaging with your ads. Engagements include any in-banner user-initiated actions that don't click-through to a landing page, such as expansions, form submissions, hovering, and twitter.
Note: Additional data will show in the exported report (in Excel) under the Engagement tab (for campaigns starting on or after Nov. 1st 2017):
- Viewable Impressions – Number of impressions served and viewed (ad was on 50% of the site for 1+seconds). *Ad units with videos need to be in view for 2+ seconds before counted as viewed.
- Viewable Rate – Viewable Impressions divided by Total Impressions.
Engagement Types
The engagement report is broken out by engagement type: overview, data capture, intent, navigation, and video. Click on the dropdown above the graph (where it shows “Overview”) to select the engagement type to display.
Engagement: Overview
The overview displays all engagements broken down by engagement type.
- Type – Lists the type of engagement.
- Engagements – Number of user-initiated events for each type of engagement.
- Percentage – Percentage of user-initiated events for each type of engagement.
Engagement: Data Capture
Creatives containing forms, polls or PDF downloads capture methods or polling components you can easily export a CSV with all your data. With "Data Capture" selected from the dropdown, you will see a "Download Form Data" button to the far right - click on this to download (screenshot below):

- Ad Name – The name of the creative built in the builder/running in the campaign with a capture method or polling component.
- Total – Total number of viewers of the specific ad’s capture method or polling component.
- Polling – Number of viewers that engaged with the specific ad’s poll.
- Forms – Number of viewers that engaged with the specific ad’s form.
- PDF – Number of viewers that viewed the specific ad’s PDF.
Engagement: Intent
Displays the number of times users hovered over an ad unit.
- Ad Name – The name of the creative built in the builder/running in the campaign.
- Total – Total number of viewers of the specific ad.
- Hover Intent – Number of viewers that hovered over specific ad.
Engagement: Navigation
Navigation engagements include ad expansions, closes and actions that open another screen within the ad.
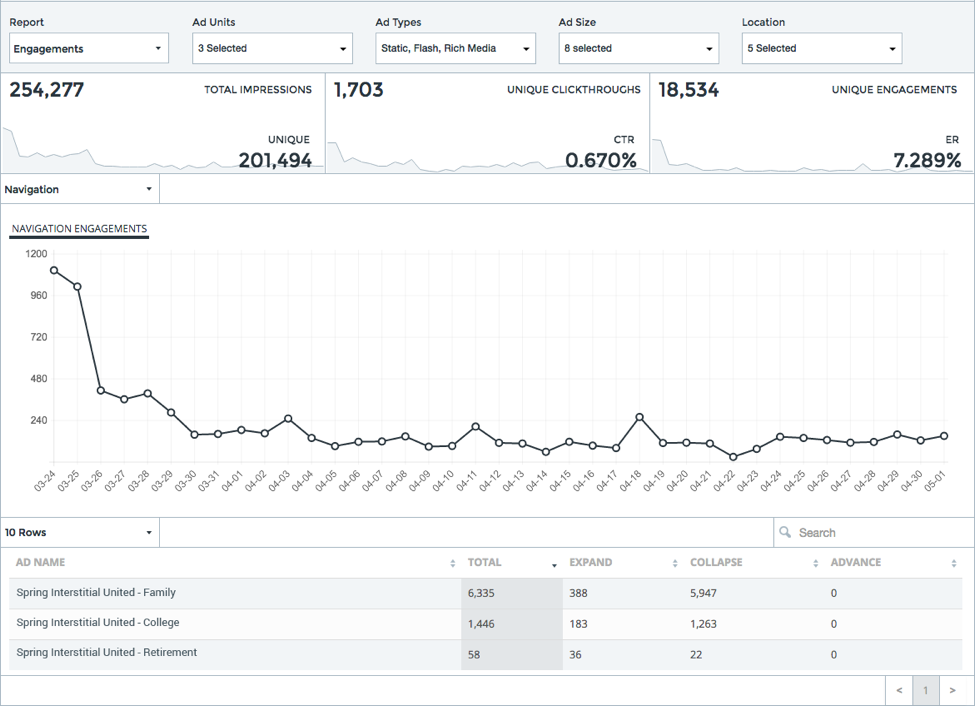
- Ad Name – The name of the creative built in the builder/running in the campaign.
- Total – Total number of viewers of the specific ad.
- Expand – Number of viewers that expanded the specific ad.
- Collapse – Number of viewers that collapsed the specific ad.
- Advance – Number of viewers that advanced through/scrolled, etc.
Engagement: Social
Social includes Twitter engagements. Use the drop down to drill down to see engagements by platform (currently twitter). For example, select Twitter to see Twitter Shares, Follows and Mentions.
- Ad Name – The name of the creative build in the builder/running in the campaign.
- Total – Total number of viewers of the specific ad.
- Twitter – Number of viewers of the specific ad’s Twitter elements.
Conversions Report
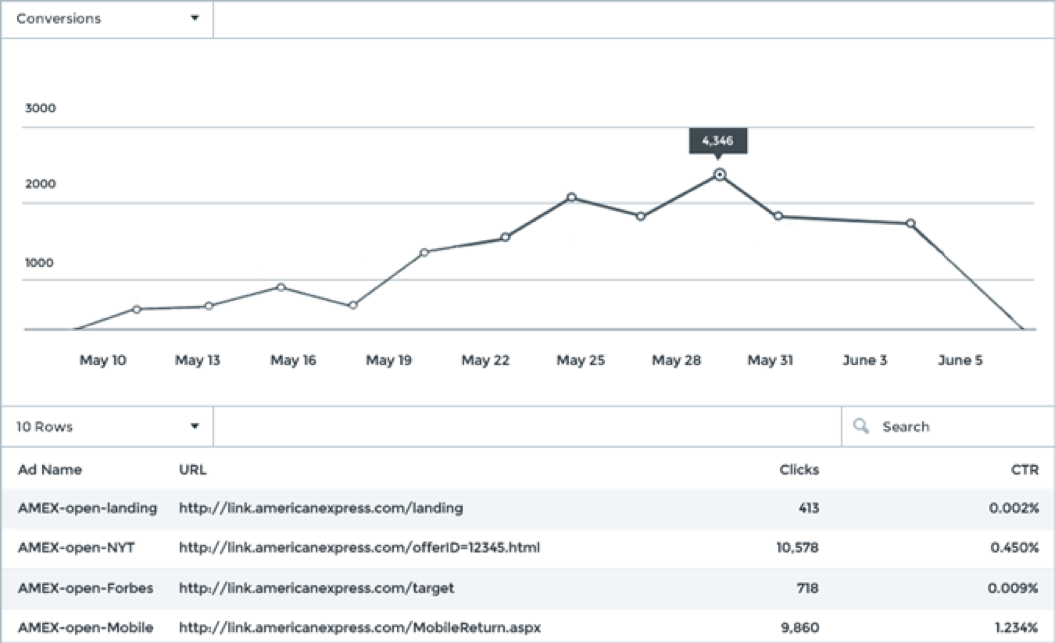
Shows total clicks, CTR, and corresponding click URL for all ad units.
- Ad Name – The name of the creative build in the builder/running in the campaign.
- Label - If a report label was entered in the Builder, it will populate here.
- URL – The corresponding click url for the specific ad.
- Clicks – Number of viewers that clicked on the url for the specific ad.
- CTR – Percentage of clicks to impressions (ratio of users who clicked on the specific link to the # of total users who viewed the ad).
Location Report
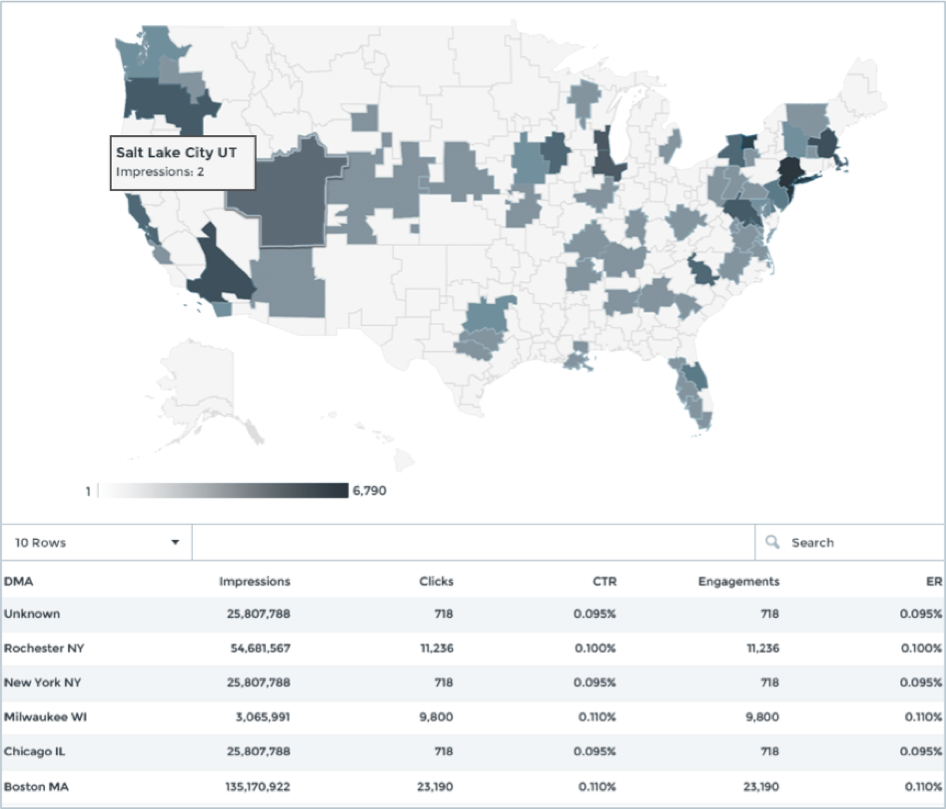
Deep dive of campaign performance by geolocation. Drill down by country, state/province or city.
- Location – Lists the name of the country, state/province or city.
- Impressions – Total number of viewers in the specific location whom impressions were delivered.
- Clicks – Total number of clicks in the specific location.
- CTR – Percentage of clicks to impressions (ratio of users who clicked in the specific location to the # of total users who viewed the ad in the specific location).
- Engagements – Number of user-initiated events in the specific location.
- ER – Ratio of unique engagements to total impressions in the specific location.
Video Report
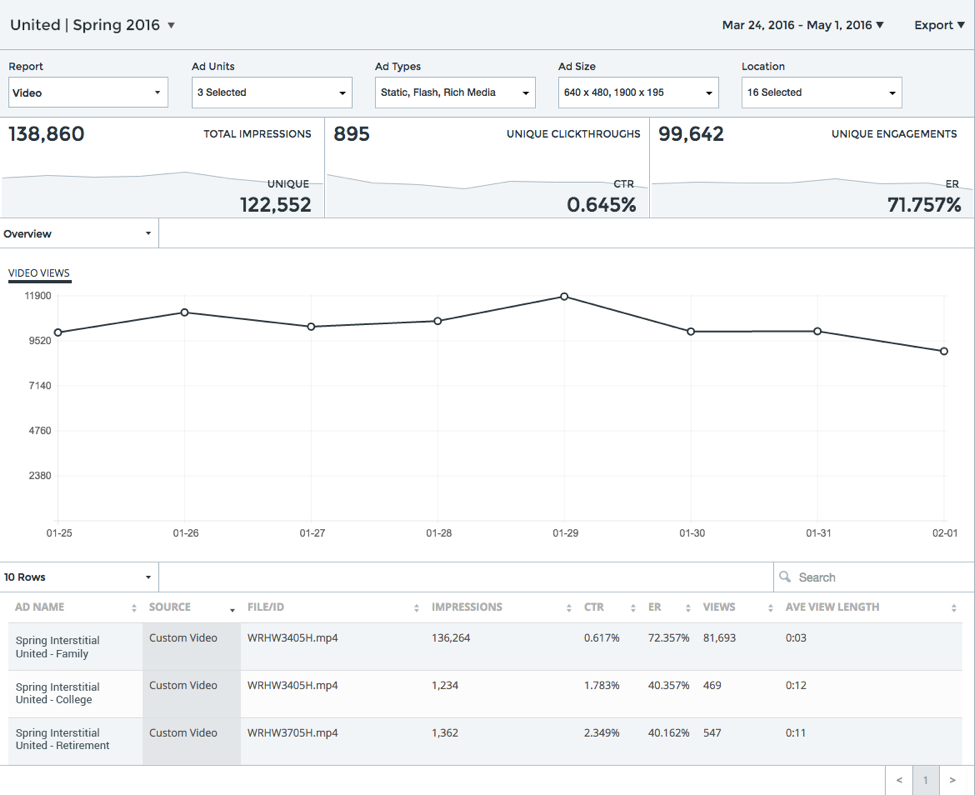
We know video content is key to engaging users, so we’ve given it its own report. Metrics include views, average view length, and total video play time as well as control engagements like replays, mutes and seeks.
- Video Completion Rate (VRC%) – Percentage of times the video played to the end. (100% column divided by the Total Plays column).
- Average View Rate (AVR%) – Percentage of the video watched by users. (i.e., if users watch an average of 20 seconds of a 30 second ad, then the average view rate is reported as 66.66%.
- Average Interaction Rate (AIR%) – Number of user interactions with a video, on average, such as Pause, Full Screen, Mute, etc. (it's the Video tabs columns for Play, Replay, Pause, Mute, Unmute, and Hover Sound added up and divided by the Total Plays column). Must be user-initiated (if they click for replay/not auto).
Video Overview:
- Ad Name – The name of the creative build in the builder/running in the campaign.
- Source – The video source/type (custom video, Youtube, VAST).
- File/ID – Video file name or Youtube ID.
- Impressions – Total number of times the ad was rendered on the page.
- CTR – Percentage of clicks to impressions (ratio of users who clicked on the video to the # of total users who viewed the ad).
- ER – Ratio of unique engagements to total impressions.
- Views – Number of video views.
- Ave View Length – Average view length in seconds.
Video Average View Length:
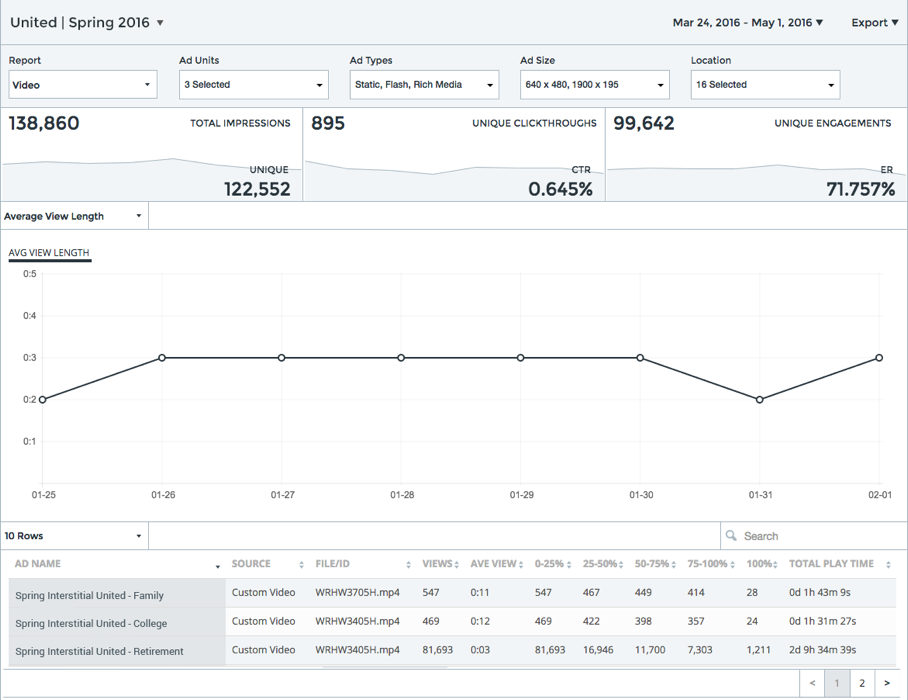
- Ad Name – The name of the creative build in the builder/running in the campaign.
- Source – The video source/type (custom video, Youtube, VAST).
- File/ID – Video file name or Youtube ID.
- Views – Total number of video views.
- Ave View – Average view length in seconds.
- 0-25% - Number of viewers that viewed first portion of the video (up to 25%).
- 25-50% - Number of viewers that viewed up to second portion of the video (up to 50%).
- 50-75% - Number of viewers that viewed up to the third portion of the video (up to 75%).
- 75-100% - Number of viewers that viewed up to the end of the video (up to 100%).
- 100% - Number of viewers that viewed the entire video (100%).
- Total Play Time – Total play time of video in days/hours/min/seconds.
Video Engagements: 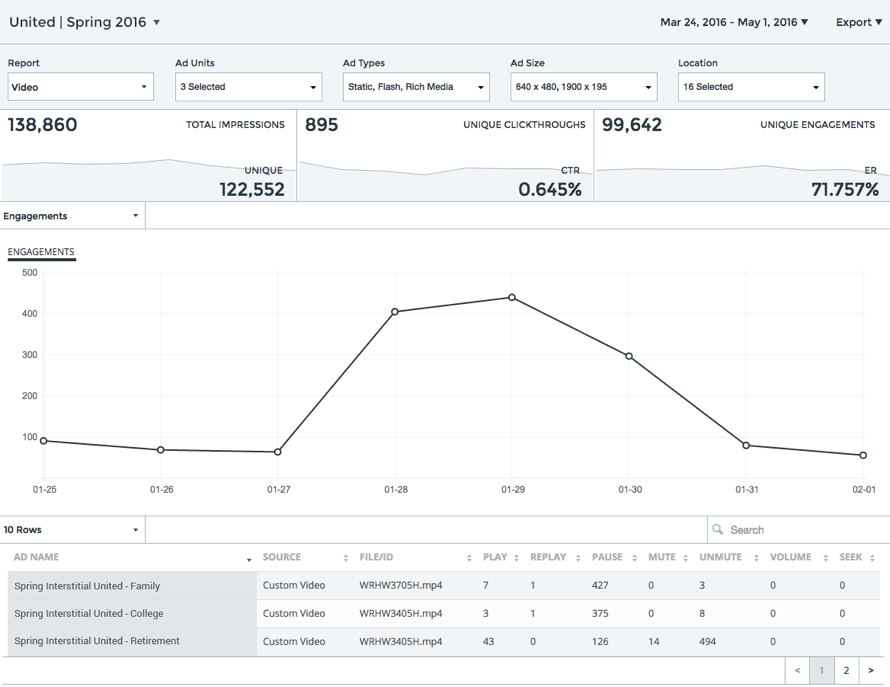
- Ad Name – The name of the creative build in the builder/running in the campaign.
- Source – The video source/type (custom video, Youtube, VAST).
- File/ID – Video file name or Youtube ID.
- Play – Number of viewers that clicked on the video play button.
- Replay – Number of viewers that clicked on the video replay button.
- Pause – Number of viewers that clicked on the video pause button.
- Mute – Number of viewers that clicked on the video mute button.
- Unmute – Number of viewers that clicked on the video unmute button.
- Volume – Number of viewers that clicked on the video volume button.
- Seek – Number of viewers that clicked on the video seek (forward/rewind) button.
Site Report
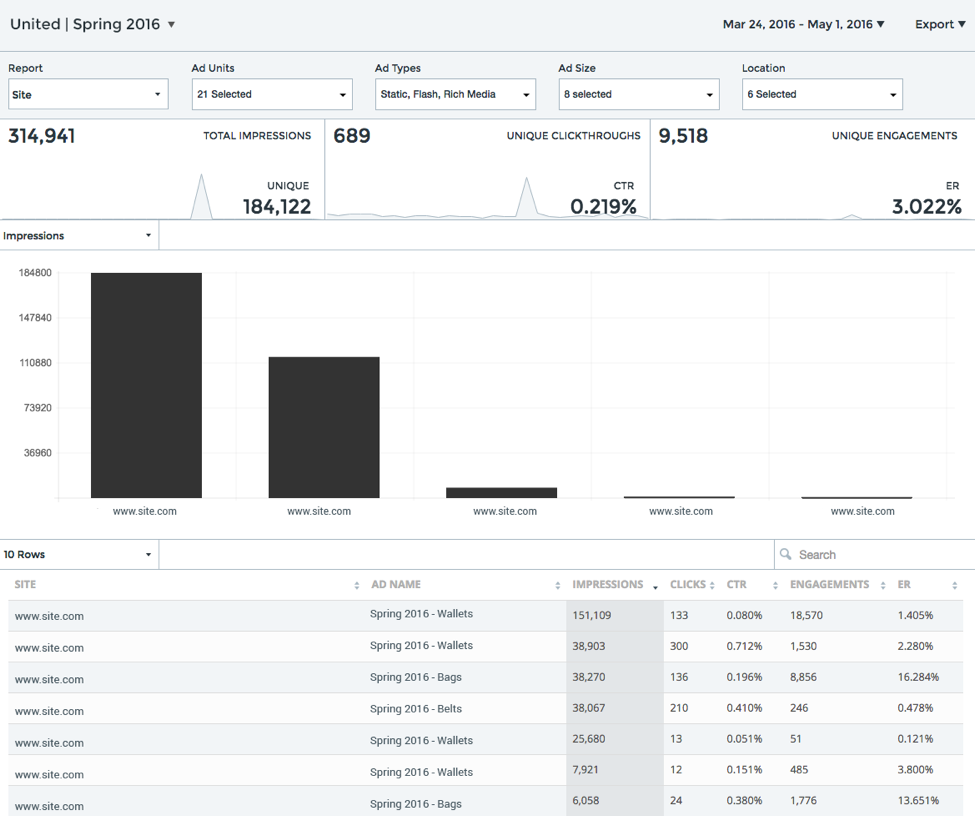
Campaign KPIs by site, down to page level URLs.
- Site – The site url of where the ad is running.
- Ad Name – The name of the creative build in the builder/running in the campaign.
- Impressions – Total number of times the ad was rendered on the specific site.
- Clicks – The number of clicks on the specific site.
- CTR – Percentage of clicks to impressions (ratio of users who click on the specific link to the # of total users who view the ad).
- Engagements – Total number of user-initiated events by site URL.
- ER - Percentage of unique engagements to total impressions by site URL.
Slideshow Report
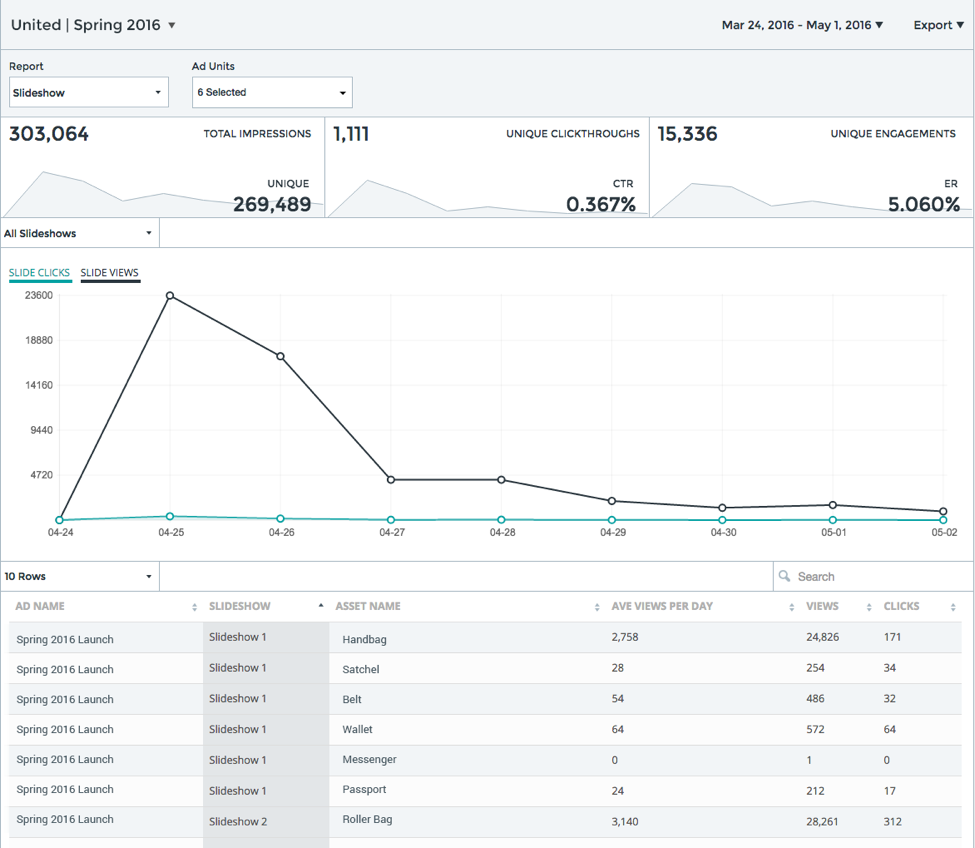
If utilizing the Slideshow component, this report will show which slides were clicked and viewed. *Shown by asset name (in case of reordering of Slide 1, 2, 3, etc.).
- Ad Name – The name of the creative build in the builder/running in the campaign.
- Slideshow – Slideshow number (slideshow 1 could have 10 slides in it/refer to asset name – see below).
- Asset Name – Name given in the builder to the individual slides (handbag, belt, wallet, etc.).
- Ave Views Per Day – Number of slideshow views per day per specific slideshow/asset.
- Views – Total number of slideshow views per specific slideshow/asset.
- Clicks – The number of clicks on the specific slideshow/asset.
Feed Parser Carousel Report
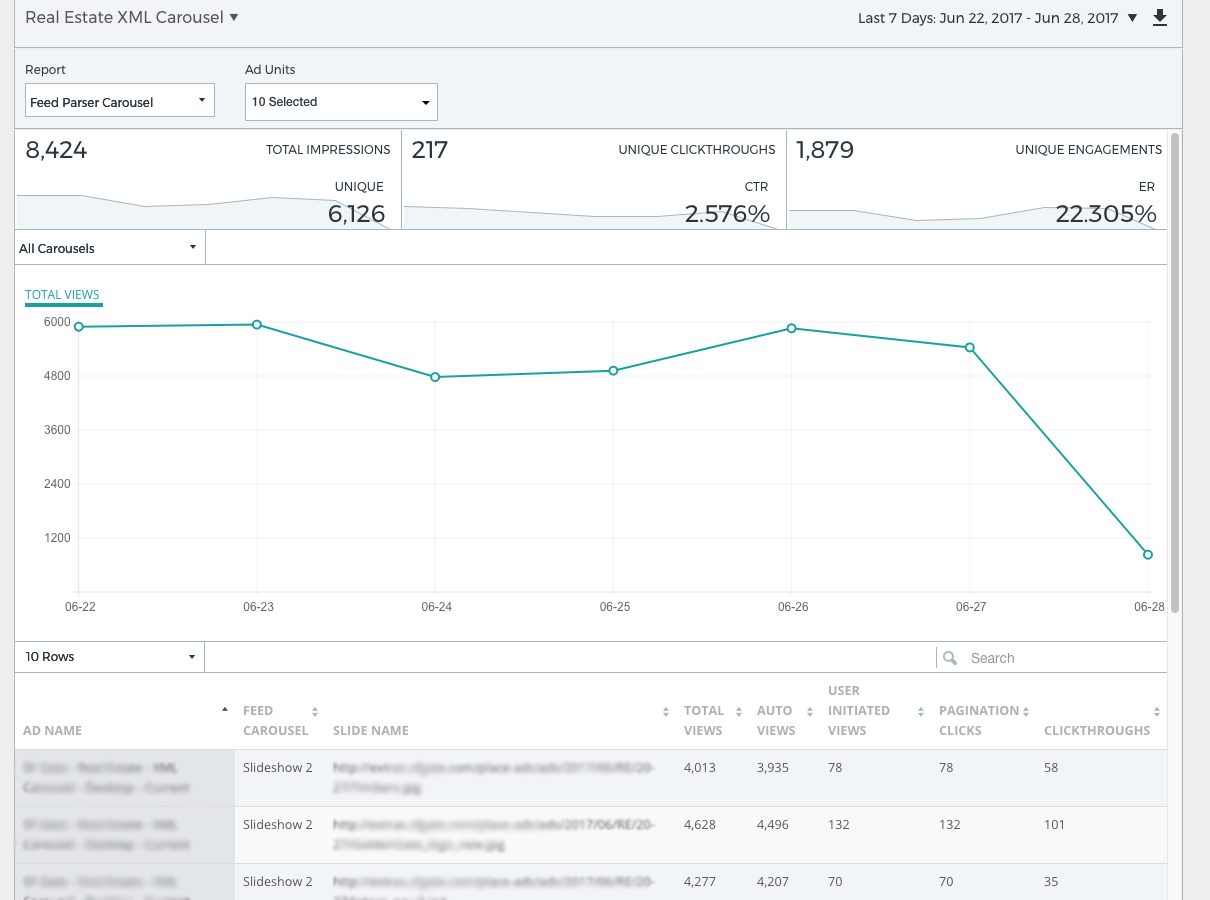
If utilizing the Feed Parser Carousel component, this report will show which slides were clicked and viewed. *Shown by slide name. You can drill down per slide by selecting the slide you wish to view by clicking on the dropdown above the graph:
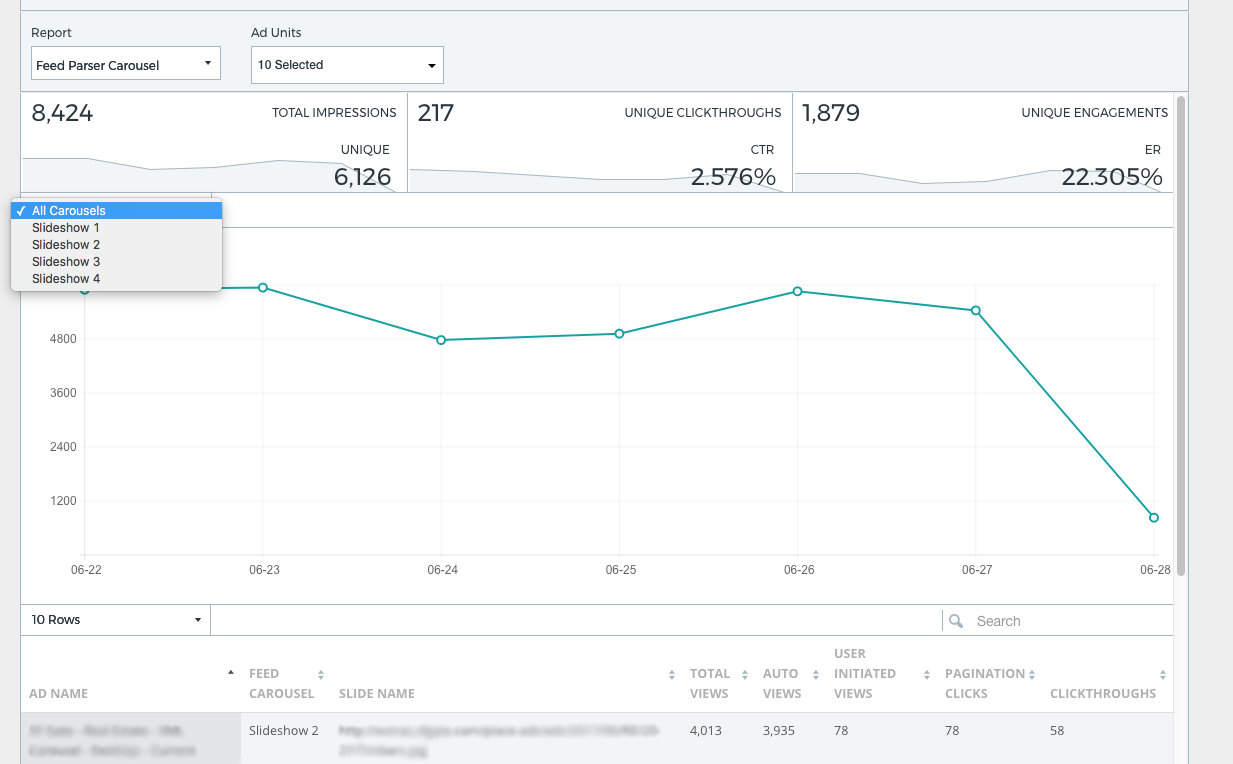
- Ad Name – The name of the creative build in the builder/running in the campaign.
- Feed Carousel – Slideshow number.
- Slide Name – Name given in the builder to the slide (i.e. url from XML feed).
- Total Views – Total number of slide views per specific slide (both auto and user-initiated = total).
- Auto Views – Total number of slide views auto-initiated.
- User Initiated Views – Total number of slide views user-initiated (clicked on).
- Pagination Clicks – Total number of user-initiated clicks on thumbnails.
- Clickthroughs – The number of clicks on the specific slide.
Technology Profile Report
The technology Profile report provides insight on the Platform OS, Browser, and Language of users.
Platform OS:
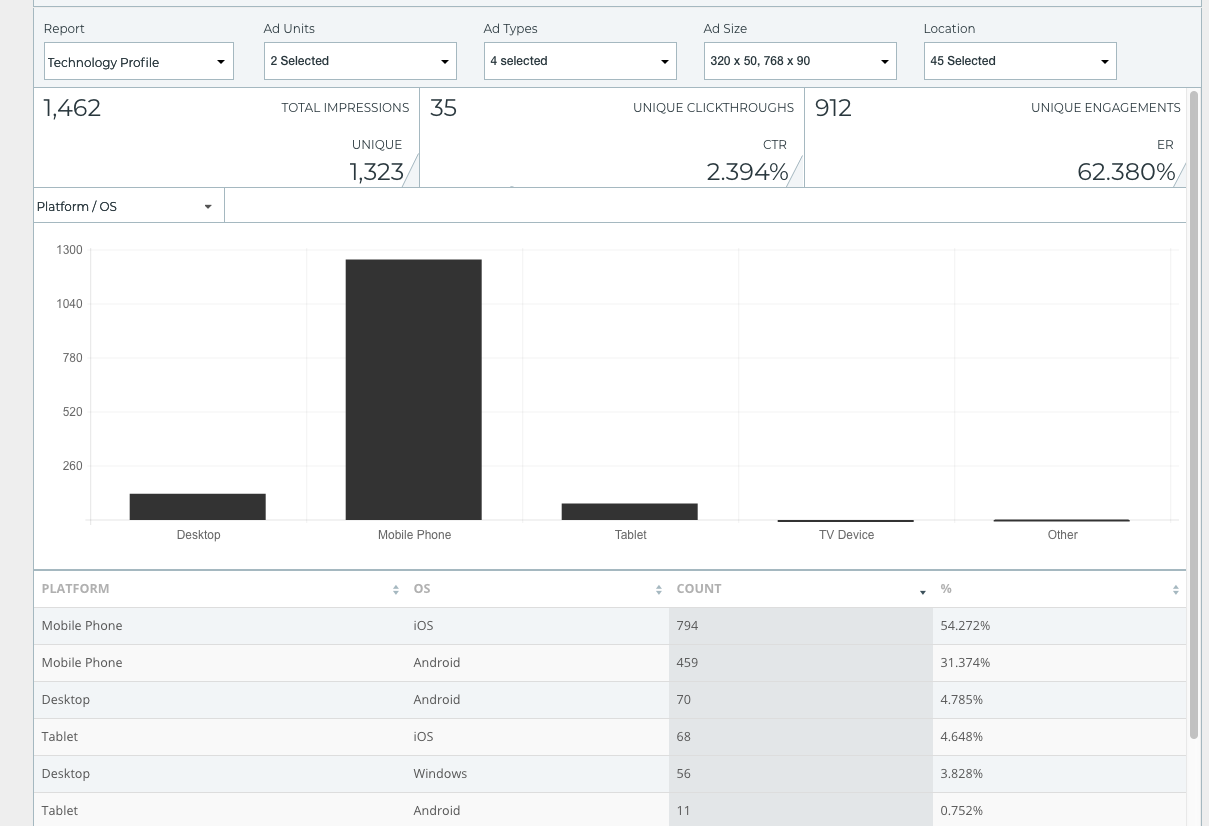
- Platform – Device: Mobile, desktop, or tablet
- OS - Operating system: Mac OS, Windows, iOS, Android, Windows Mobile, Linux, Chrome OS, Other/Unknown
- Count - Number of times an ad was rendered on the platform/OS
- Percentage - The count divided by the total impressions
OS Browser:
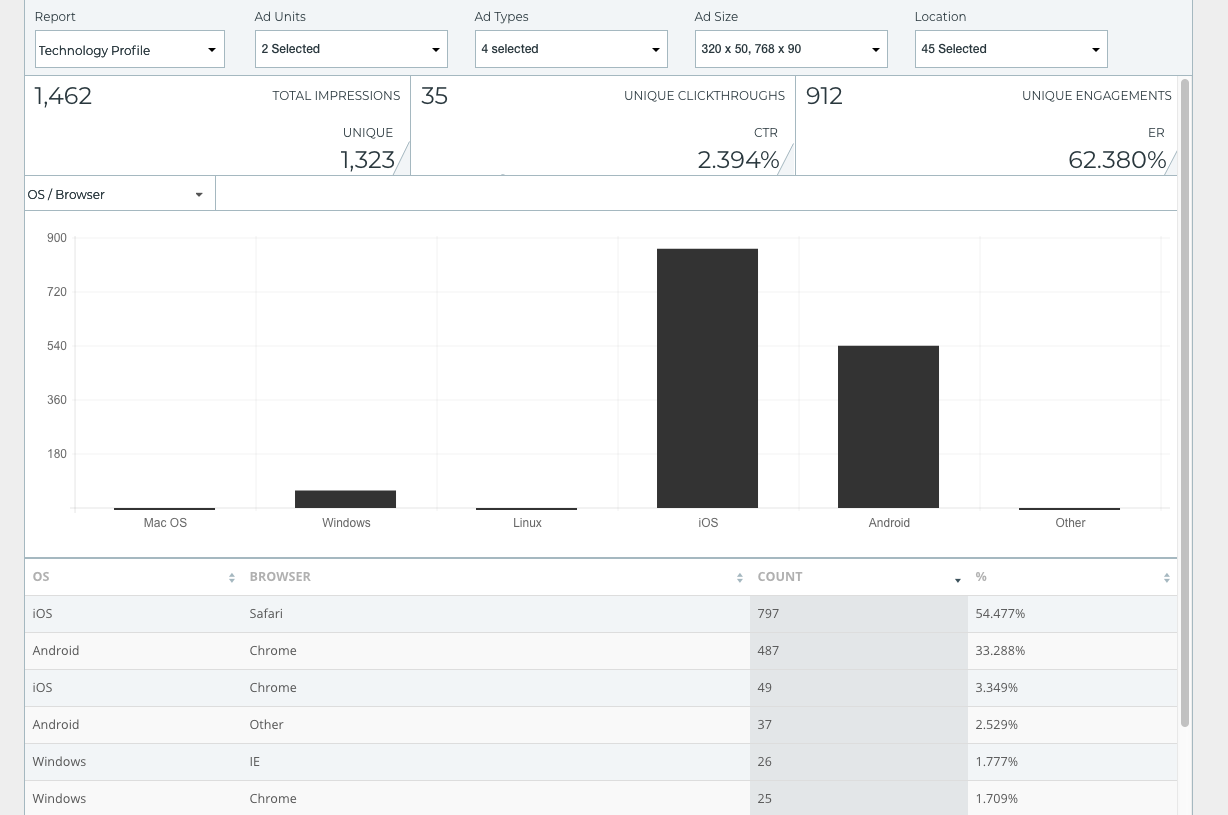
- OS - operating system: Mac OS, Windows, iOS, Android, Windows Mobile, Linux, Chrome OS, Other/Unknown.
- Browser - Internet browser: Safari, Chrome, IE, Firefox, Other/Unknown.
- Count - Number of times an ad was rendered on the OS/Browser.
- Percentage - The count divided by the total impressions.
Language:
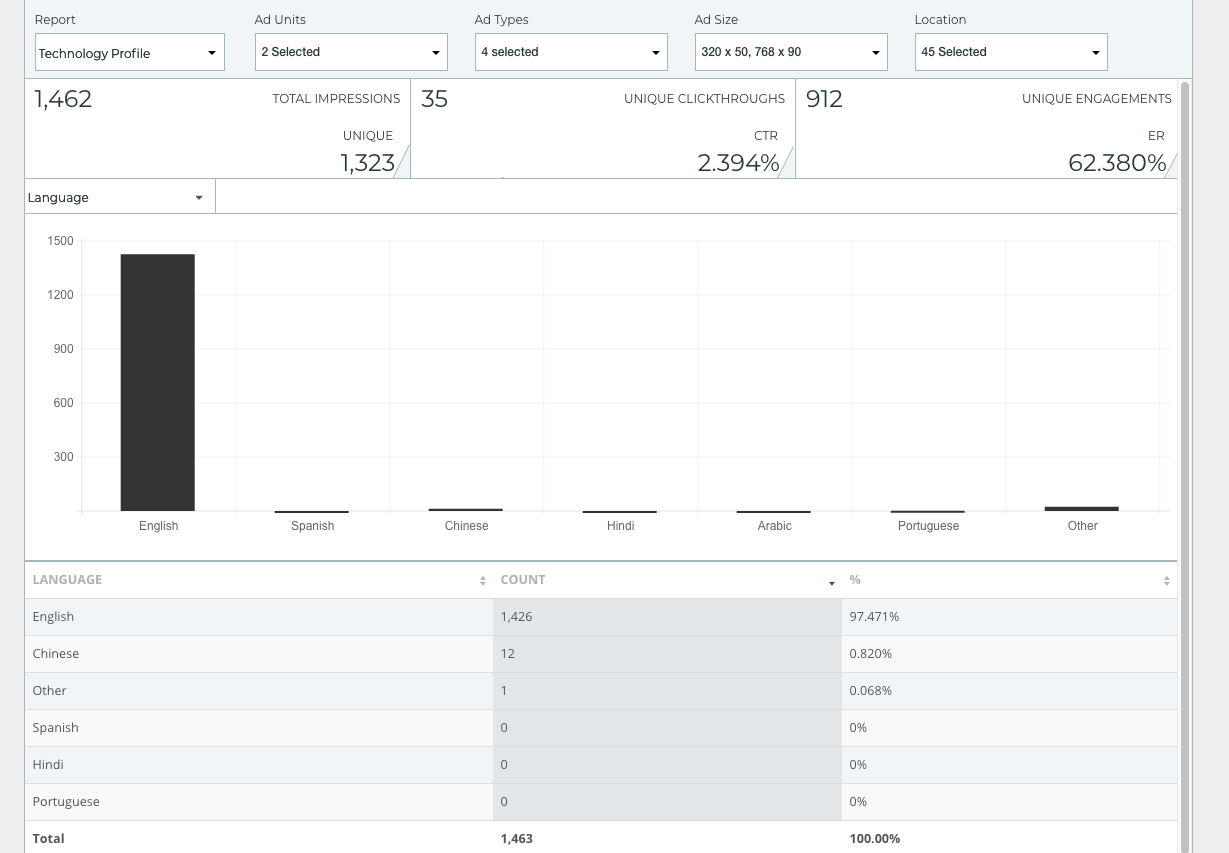
- Language - User's language.
- Count - Number of times an ad was rendered for the language.
- Percentage - The count divided by the total impressions.